The fastest reliable path into data analytics follows a consistent order: start with Excel to build core data-handling instincts, move to SQL to query real databases, add Python once you need to handle messier or larger data, learn Power BI to visualize and present findings, and then apply all of it to real, portfolio-worthy projects. Skipping straight to the "impressive" tools without this foundation is the most common reason beginners stall out.
Step 1: Excel — Build the Instincts First
Excel isn't a legacy skill to rush past — it's where most people first learn to think in terms of rows, columns, filters, pivot tables, and formulas like VLOOKUP/XLOOKUP and SUMIFS. These instincts transfer directly into SQL and Python later, and in many smaller businesses, Excel remains the actual tool of daily work. Spending two to three focused weeks here pays off later.
Step 2: SQL — The Real Data-Pulling Skill
Almost every real dataset worth analyzing lives in a database, not a spreadsheet someone emailed you — which makes SQL the single most universally required skill in data analytics job postings. Focus on SELECT, WHERE, JOIN, GROUP BY, and window functions; that combination covers the large majority of real analyst work.
Step 3: Python — For Everything Excel and SQL Can't Handle Cleanly
Python (specifically pandas) becomes necessary once datasets get too large or messy for Excel, or when a task needs to be automated and repeated rather than done manually each time. It's not a replacement for SQL and Excel — it's what you reach for once those two hit their limits.
Step 4: Power BI — Communicating What You Found
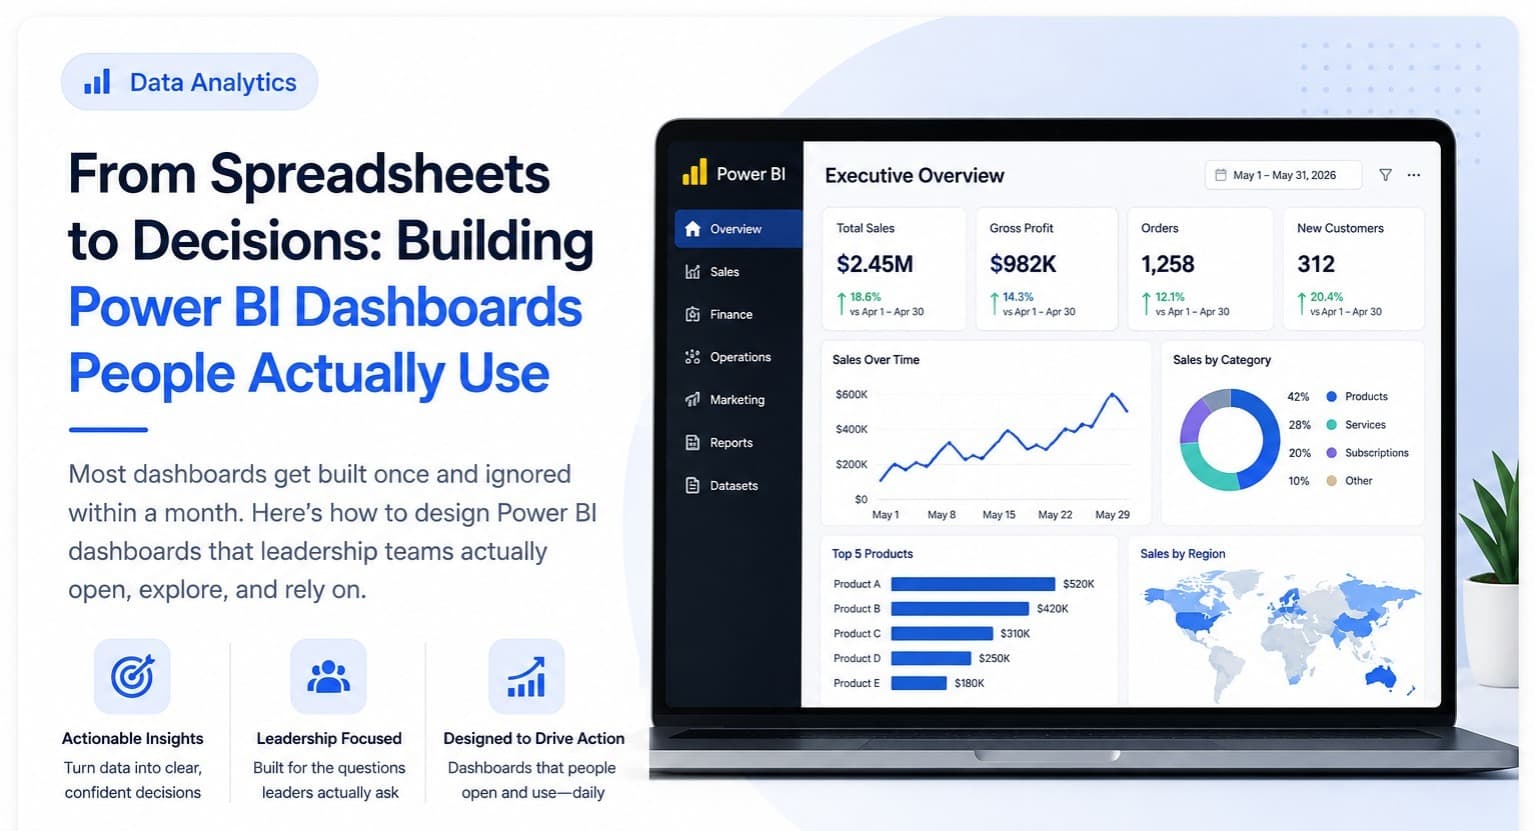
Analysis nobody sees or understands doesn't change any decision. Power BI is where raw findings become a dashboard a manager can actually open and act on — and building dashboards people keep coming back to is its own skill, distinct from the underlying analysis.
Step 5: Real Projects — Where It All Comes Together
None of the above matters to an employer without evidence you can apply it to a messy, realistic problem end to end. Our Data Analytics Projects guide walks through the kind of project that actually demonstrates this, and our online Data Analytics course is structured around exactly this sequence — Excel, SQL, Python, Power BI, and a capstone project — with an internship component and career support once the technical skills are in place.
How Long Does This Actually Take?
For someone starting from zero with consistent effort (roughly 8-10 hours a week), a realistic timeline is 3-4 months to reach a genuinely job-ready level across all four tools plus a portfolio project — faster with full-time focus, slower with less consistent time. There's no shortcut around the practice time itself, but there is a wrong order to learn things in, and following this sequence avoids the most common one (jumping to Python or machine learning before the SQL/Excel fundamentals are solid).