Skip to content
All Solutions

Dashboard & BI Solutions

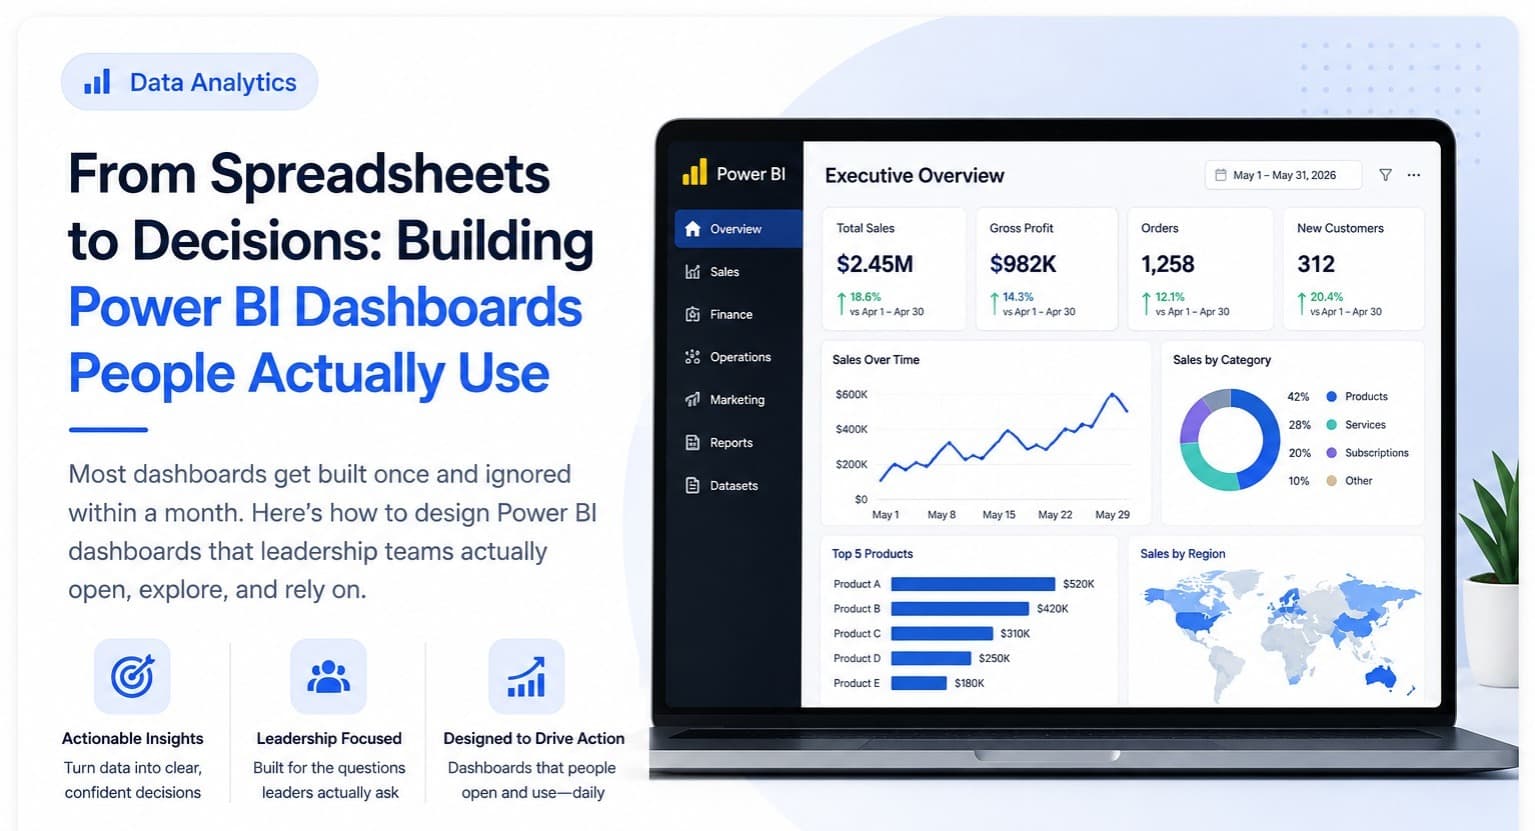
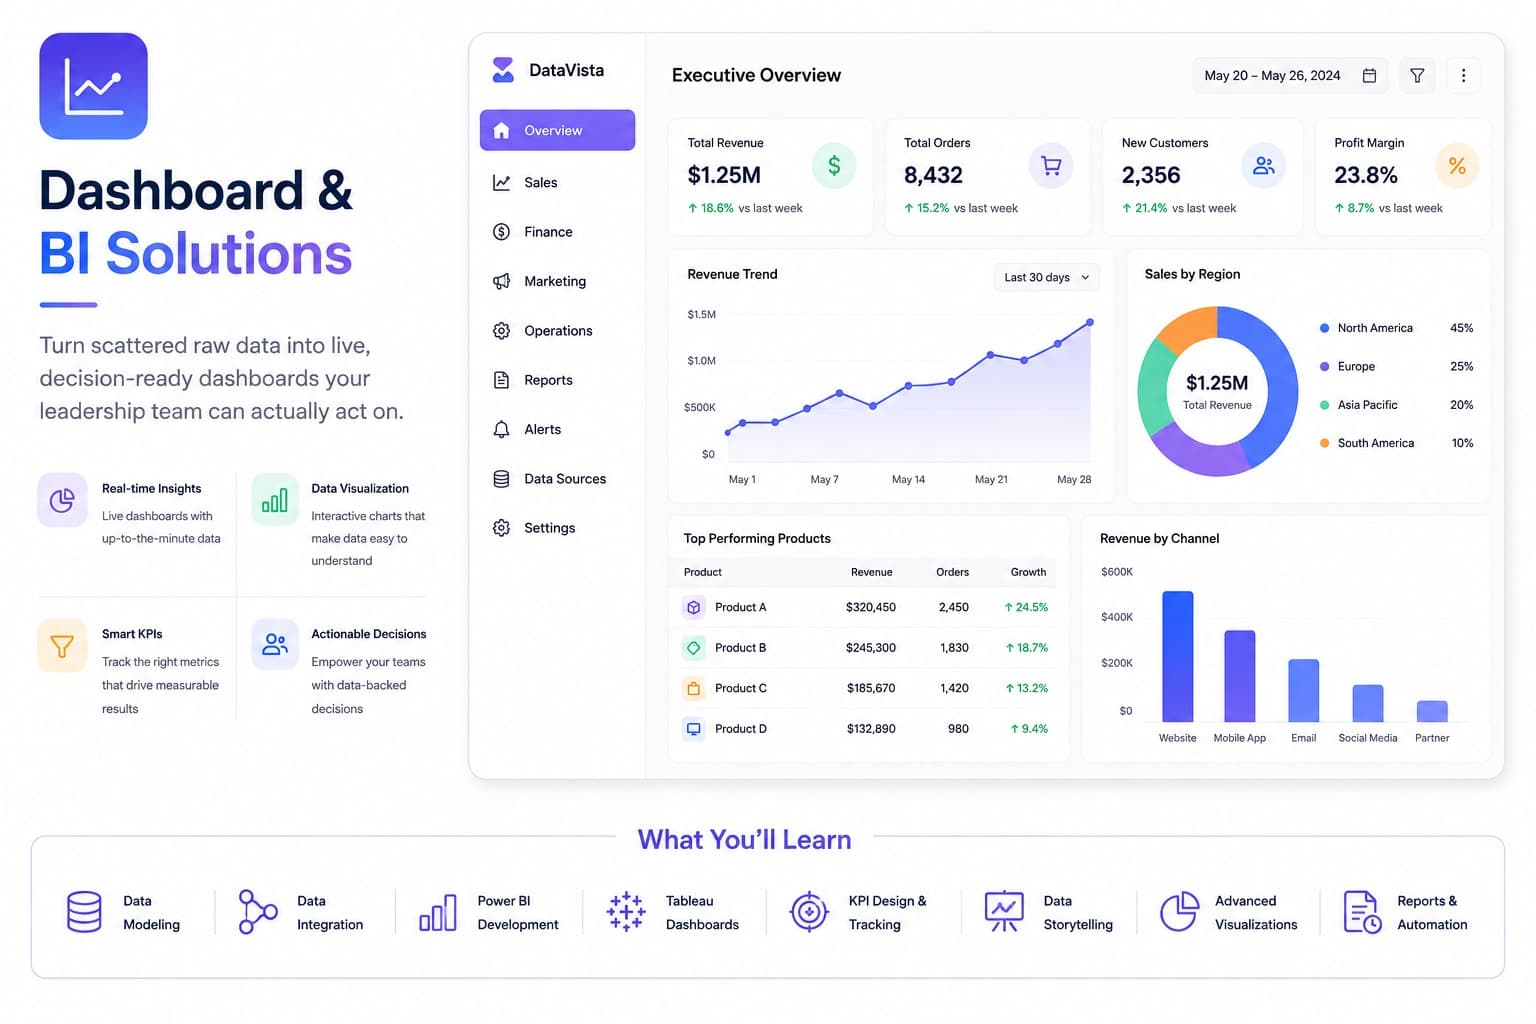
Dashboard & BI Solutions turn scattered raw data into live, decision-ready dashboards — interactive Power BI dashboards, fully custom analytics dashboards, executive KPI reporting, sales/revenue visibility, and data warehousing that unifies multiple source systems into one queryable place, with automated scheduled reporting.

Turn scattered raw data into live, decision-ready dashboards your leadership team can actually act on.

Dashboard & BI Solutions

Problems We Actually Solve

Real situations clients across these industries come to us with — and how dashboard & bi solutions fixes them.

Education (Schools & Colleges)

The problem: A school group running multiple campuses has no single view of enrollment, fee collection, or attendance across all of them.

How we solve it: We build one dashboard pulling live data from every campus, so leadership sees the full picture instantly instead of chasing each campus separately.

Healthcare

The problem: A multi-branch clinic chain struggles to see which locations are actually profitable versus which are quietly underperforming.

How we solve it: We build a branch-wise performance dashboard, so underperforming locations are visible immediately, not discovered a quarter later.

Retail

The problem: These clients run multiple businesses or branches and have no single view of how each one is actually performing.

How we solve it: We build a dynamic dashboard pulling live data from every branch or business into one place, so leadership sees the full picture instantly.

Finance & Services

The problem: Getting a simple revenue report means waiting on someone to manually compile numbers from several systems.

How we solve it: We connect every data source directly into a live dashboard, so the numbers are always current with zero manual compiling.

Deliverables

What you actually get from a dashboard & bi solutions engagement.

Real-time dashboards pulling from multiple data sources
Custom KPI tracking, drill-downs, and cohort views
Automated report scheduling and export to PDF or Excel
Built on Power BI or fully custom analytics interfaces

Technologies Used

Power BISQLData Warehousing (ETL)ReactREST APIsScheduled Report Automation

Expected Timeline

Timeline depends on scope and complexity — confirmed together during your discovery call.

Pricing

Dashboard & BI Solutions packages & prices

Starting prices with our current launch offer. All amounts in INR, plus applicable taxes. Your quotation confirms the exact deliverables, exclusions and delivery estimate before payment.

  • Predictive analytics

    Quote after assessing data readiness, target outcome and evaluation needs.

  • Power BI dashboard

    One clean data source, up to 3 report pages and 10 measures.

    ₹14,999Launch offer ₹9,999from · one-timeSelect Package →
  • Data cleaning

    One dataset, up to 10,000 rows and 20 columns; agreed cleaning rules.

    ₹6,999Launch offer ₹4,999from · one-timeSelect Package →
  • Batch data pipeline

    One source to one destination, daily batch schedule, logs and basic alerts.

    ₹34,999Launch offer ₹24,999from · one-timeSelect Package →

AI offers are starter implementations or pilots, with agreed usage limits. OCR, fine-tuning, complex permissions and production scaling are separate. Model API charges, cloud storage, BI licences and third-party subscriptions are excluded.

Your approved project scope is delivered at the agreed price. Additional scope or change requests are quoted separately before any extra work begins.
Our Process

How We Deliver Dashboard & BI Solutions

The same straightforward process behind every project, regardless of size.

  1. 1

    Step 1: Discovery

    We start by understanding your actual workflow, goals, and constraints — no generic templates, just a conversation about what you need.

  2. 2

    Step 2: Proposal

    You get a written scope, timeline, and price before any work begins. Anything outside that approved scope is quoted separately as a change request.

  3. 3

    Step 3: UI/UX Design

    Where the project has a user-facing interface, we agree on screens and user flows with you before development starts.

  4. 4

    Step 4: Development

    We build in phases with regular check-ins, so you see progress and can give feedback along the way, not just at the end.

  5. 5

    Step 5: Testing

    Each phase is tested against the agreed scope before release, and you review it before it goes live.

  6. 6

    Step 6: Launch

    We handle deployment and go-live, including data migration where the project needs it.

  7. 7

    Step 7: Support

    We stay on for a post-launch support window, with the option of ongoing maintenance afterward.

Rather learn to do this yourself?

Data24Zone Academy teaches the same skills behind this service — for individuals or for your in-house team.

What Clients Say

“Data24Zone rebuilt our sales process from the ground up. Our team now closes deals faster and reporting time that used to take a full day happens in minutes. Best decision we made this year.”

Distribution & Wholesale· client name withheld by request

Frequently Asked Questions

How long does a typical dashboard & bi solutions project take?

Timelines depend on scope — a focused project can take a few weeks, while a larger multi-module build can run several months. We give you a realistic timeline after an initial scoping call, and break larger projects into phases so you see working results early rather than waiting for one big launch.

Do we need to already have our tech stack or tools decided?

No — we're happy to work within tools you already use (like your existing CRM, ERP, or hosting setup), or recommend a stack from scratch if you're starting fresh. We'll flag it upfront if an existing tool genuinely isn't a good fit, but the default is to fit into what you already have wherever practical.

Do we have to commit to all of Dashboard & BI Solutions at once?

No — Dashboard & BI Solutions covers a range of specific needs (Power BI Dashboards, Custom Analytics Dashboards, Executive KPI Reporting, and more), and most clients start with the one piece that matters most right now and expand later.

What happens after launch — is support included?

Every project includes a post-launch support window to fix anything that surfaces under real usage. After that, you can move to an ongoing maintenance and support arrangement if you want continued monitoring, updates, and priority fixes — it's optional, not forced.

How many rounds of revisions do we get?

We scope revisions into the project plan upfront rather than treating them as an afterthought — you review work at each phase, not just at the very end, so feedback gets folded in as we go instead of piling up into a single high-stakes final review.

Do you only work with businesses in specific industries for Dashboard & BI Solutions?

We've built this for a range of industries — including Retail, Manufacturing, Education, Healthcare — but the underlying process is the same regardless of industry: understand your actual workflow first, then build around it.

Other Services

Ready to get started with Dashboard & BI Solutions?

Tell us about your project and we'll help you scope the right solution — no obligation, just a clear plan forward.

Get Started