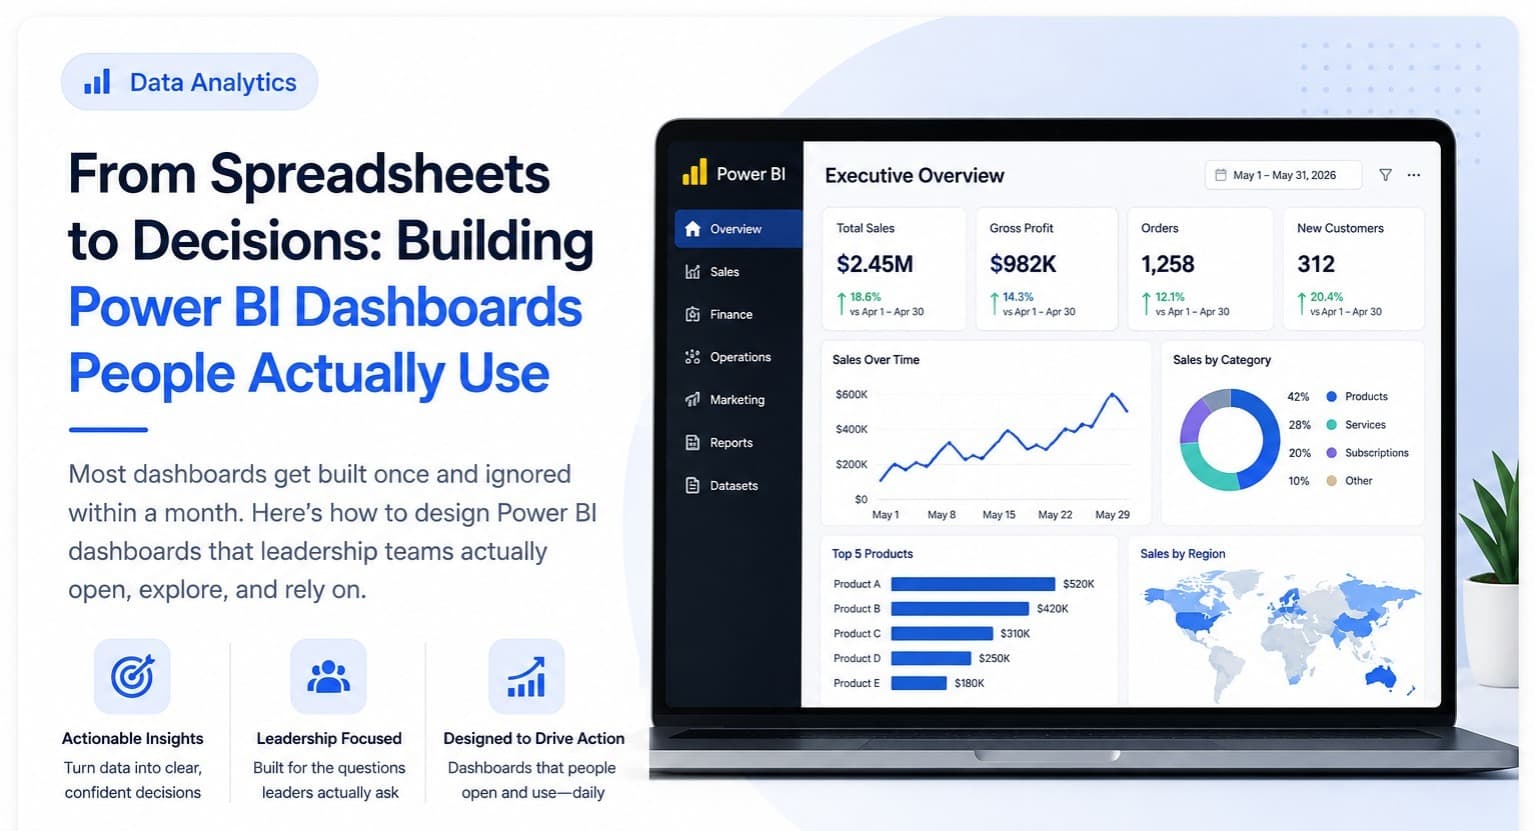
A data analytics project demonstrates real, hireable skill when it involves a genuinely messy dataset, a specific business question, and a clear final output — not a clean sample dataset run through a tutorial's exact steps. The difference is obvious to anyone reviewing a portfolio: tutorial-following looks identical across a hundred candidates, while a real, self-directed project looks different every time.
1. A Sales or Revenue Performance Dashboard
Take a real or realistic sales dataset (product, region, rep, date, revenue) and build a dashboard answering a specific question — which regions are underperforming their targets, which reps are trending down month over month, which products drive disproportionate revenue. The skill being demonstrated isn't the chart-building, it's choosing which five numbers actually matter out of fifty possible ones.
2. A Customer Churn or Retention Analysis
Using a subscription or customer dataset, identify which customer segments churn most and investigate why — tenure, usage patterns, support ticket history, or plan type are common angles. This project demonstrates the ability to move from a broad question ("why are we losing customers") to a specific, evidence-backed answer, which is the core of real analyst work.
3. A Multi-Source Data Cleaning Project
Deliberately combine two or three messy, inconsistent data sources (different date formats, inconsistent naming, missing values) and document the cleaning decisions made along the way. This is one of the most underrated project types — cleaning is where most real analyst time actually goes, and a project that shows this process explicitly (not just the final clean result) signals real experience.
4. A Marketing or Web Analytics Funnel Analysis
Using campaign or web traffic data, analyze a conversion funnel end to end — where visitors drop off, which channels convert best, what a realistic cost-per-acquisition looks like by channel. This project pairs particularly well with SQL and Power BI together, since it typically involves pulling from a database and presenting to a non-technical stakeholder.
5. An End-to-End Capstone: Raw Data to Live Dashboard
The strongest single portfolio piece combines everything — pulling raw data with SQL, cleaning and analyzing it in Python or Excel, and presenting the result as a Power BI dashboard with a short written summary of the key finding. This is deliberately the format of the capstone project in our online Data Analytics course — it's the version of a project that mirrors what an actual analyst does at work, start to finish, rather than practicing one tool in isolation.
What to Actually Write About Each Project
For every project, write two or three sentences on the specific decision your analysis would support — not just "I analyzed sales data" but "I found that Region C consistently misses target in Q4 due to a specific product line, which would let a sales lead reallocate focus before the quarter ends." That framing, more than any chart, is what signals real analytical thinking to whoever's reviewing your portfolio.