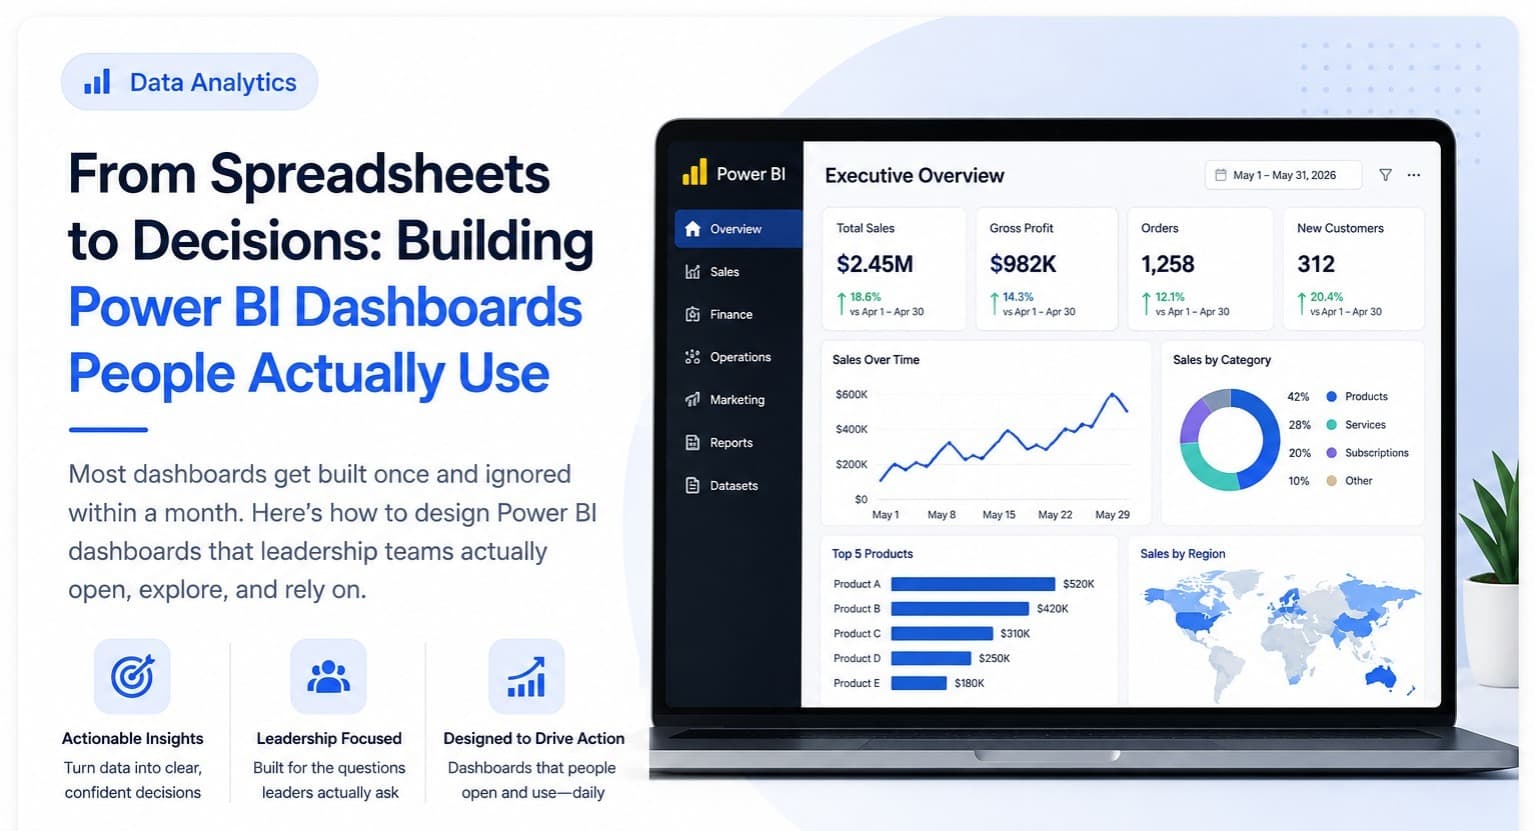
Data analytics is the process of collecting, cleaning, and examining data to answer specific questions and support decisions — not a single tool or job title, but a set of skills applied to real business problems like "why did sales drop in March" or "which customers are about to churn." The output of good data analytics is always an answer someone can act on, not just a chart.
What Data Analytics Actually Involves
In practice, a data analytics project moves through a consistent set of stages regardless of industry:
- Collecting data from wherever it actually lives — a database, a CRM export, spreadsheets, an API, or a combination of all four.
- Cleaning it — fixing inconsistent formats, removing duplicates, and handling missing values, which typically takes far longer than any other step and is the part most beginners underestimate.
- Analyzing it — using SQL, Excel, or Python to look for patterns, trends, and outliers relevant to the actual question being asked.
- Visualizing and communicating it — usually in a tool like Power BI, so the answer reaches someone who can act on it without needing to read raw numbers themselves.
What Data Analytics Is Not
It's worth being precise about the boundary, since the terms get used loosely. Data analytics is generally backward- and present-looking — explaining what happened and why — while data science leans more into predicting what will happen next using statistical models and machine learning. A data analyst answering "which product category is underperforming this quarter" is doing analytics; a data scientist building a model to predict which customers will churn next month is doing data science. The two overlap heavily in practice, and many people do both, but the core distinction — explaining the past versus predicting the future — is a useful one to keep in mind.
Where Data Analytics Shows Up in a Real Business
Nearly every department ends up needing it in some form: marketing teams analyzing which channels actually drive conversions, finance teams reconciling and forecasting budgets, operations teams tracking fulfillment times and defect rates, and leadership teams needing a single reliable view of how the business is actually performing instead of five conflicting spreadsheets. This is also why analytics skills transfer well across industries — the tools (SQL, Excel, Python, Power BI) and the underlying thinking (define the question, find the data, clean it, analyze it, communicate it clearly) stay the same whether you're working in retail, healthcare, or software.
Getting Started
If this sounds like a field you want to move into, the practical starting point is usually SQL (for pulling data out of real databases) and Excel or Power BI (for analyzing and presenting it), followed by Python once you're handling larger or messier datasets. Our Data Analyst Roadmap breaks this down step by step, and our online Data Analytics course covers all of it hands-on with real projects, from raw spreadsheets through to a finished Power BI dashboard.